Demographic data representation in Nvivo
The previous article explained how to generate queries within the data processed. This article explains the succeeding step of data visualization of results generated for the case research. Data visualization is a technique for data representation in the form of tables, charts and diagrams. This article explains representation of demographic information of the participants (e.g. teachers) based on nodes in Nvivo. For demographic data representation, Nvivo has a special feature known as ‘Classification’. This article will cover following items:
- To create classification.
- To link case nodes to classification.
How to create classification for demographic data representation in Nvivo?
Classification stores any type of information about the participants or source or both. It represents data according to demographic variables. For example, for the case research, it will indicate the teaching preference of teachers as per location. The first step is to create a case classification.
- Go to ‘Classification’.
- Select ‘Create’.
- Click on ‘Case classification’.
- Select ‘Create a new classification’.
- Lastly, enter name and click on ‘OK’.
The ‘Name’ and ‘Description’ fields of the case classification will be recorded. Here the classification is named as ‘Participants’. Then click on ‘Ok’. Filling out ‘Description’ box is optional, therefore it can be left blank (figure below).

A new classification ‘Participants’ appears in the ‘Classification’ window. To view it:
- Click on ‘Classification’ (Main Menu).
- Click on ‘Case Classification’.
Adding demographic details
To add demographic details into the case classifications participants:
- Click on ‘Participants’.
- Click on ‘Create’.
- Lastly, select ‘Attributes’.
A dialogue box will appear in order to add attributes (demographic details) in ‘Classification’ (participants). ‘General’ tab of the dialogue box indicates general details like name and description of the attribute. For instance, in the case research, the first demographic information was location of the school. So name this attribute as ‘Location’.

The ‘Values’ tab allows to add options. These options are different responses generated during an interview. This case research includes eight schools from four regions of Delhi. Therefore, the options for locations are North Delhi, South Delhi, East Delhi and West Delhi. To enter the locations, click on ‘Add’ (figure below). Thereafter, click on ‘Ok’.

Similarly, create other attributes like years of experience, classroom strength, number of subjects, and number of classes for teachers. All responses entered will be recorded. After adding all the necessary attributes recorded during interview, the case classification (participants) will emerge:

To link case nodes to classification
To view all the attributes or demographic details according to all the participants, connect nodes to the case classifications. Moreover, connection between them helps to view the attributes of the participants or variables in two ways. Here, to view the attributes in participant classification as per the case nodes of participants:
- Click on ‘Nodes’.
- Click on ‘Case Nodes’.
- Select all the case nodes.
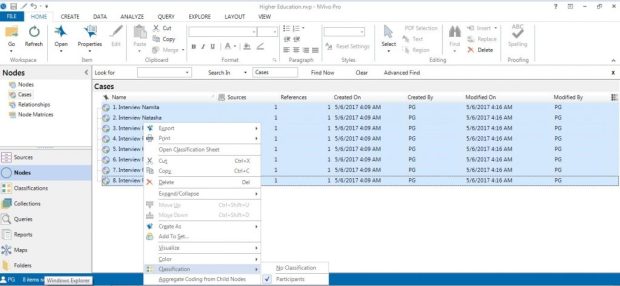
- Right click and click on ‘Classification’.
- Finally, select case classifications (participants in present case).
The attributes as per the participants now appear in the form of two way tables (figure below):
- Click on ‘Classifications’.
- Select ‘Participants’.

Selecting demographic details of each participant
Select the demographic details of each of the participant manually using the filters of the detail table. In order to do so, you can select manually the location of all the participants in the two ways table.

This article explained how demographic information of participants is arranged and visualised using ‘Classification’ feature. Classification feature helps to store all the demographic information at one place. Here the participants’ location, years of experience, classroom strength, subjects, number of classes etc. were classified. It connected their perception or attitude to quality of education, represented through qualitative representation and queries.
I am a management graduate with specialisation in Marketing and Finance. I have over 12 years' experience in research and analysis. This includes fundamental and applied research in the domains of management and social sciences. I am well versed with academic research principles. Over the years i have developed a mastery in different types of data analysis on different applications like SPSS, Amos, and NVIVO. My expertise lies in inferring the findings and creating actionable strategies based on them.
Over the past decade I have also built a profile as a researcher on Project Guru's Knowledge Tank division. I have penned over 200 articles that have earned me 400+ citations so far. My Google Scholar profile can be accessed here.
I now consult university faculty through Faculty Development Programs (FDPs) on the latest developments in the field of research. I also guide individual researchers on how they can commercialise their inventions or research findings. Other developments im actively involved in at Project Guru include strengthening the "Publish" division as a bridge between industry and academia by bringing together experienced research persons, learners, and practitioners to collaboratively work on a common goal.
Discuss