How to detect outliers in a dataset?
Outliers are those data points which are distant from the other observations in the data set. They can be either because of the variability in the data set or due to measurement errors. They represent a large variation across a data set. Presence of an outlier in data sets confirms that one or more than one of all the observations starkly differs with other observations. For instance, given a data set X:
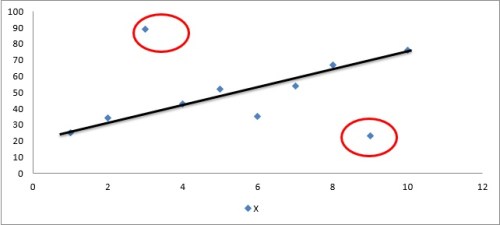
| X | 25 | 34 | 89 | 43 | 52 | 35 | 54 | 67 | 23 | 76 |
Figure 1 below represents this dataset in a graph. While constructing a scatterplot of dataset X, notice that two of the observations of data set (encircled) starkly differ with others. One outlier with value 89 appears far above the trend line, which represents a positive outlier. Another outlier with value 23 appearing far below the trend line represents a negative outlier.
Implications of outliers in a dataset
The presence of outliers corrodes the results of analysis. For instance, with the presence of large outliers in the data, the data loses are the assumption of normality. Furthermore, the measures of central tendency like mean or mode are highly influenced by their presence. In predictive modeling, they make it difficult to forecast trends. This is because outliers in a dataset can mislead researchers by producing biased results. Therefore, it is important to detect them in the data (if any). There are both graphical and numerical methods to detect them.
Graphical methods to detect outliers
Scatterplot
Scatterplot is the graph representing all the observations at one place. The scatterplot indicated below represents the outlier observations as those isolated with rest of the clusters. It is the simplest form of detecting outliers in the data. The points marked in the figure below show them in a scatterplot.

Normality plots
Normality plots graphically represent the extensive departure of the data set from normality assumption. For instance, observations far away from the trend lines indicate that data might not satisfy the normality assumption. As shown in the figure below, not many observations are far away from the trend line, indicating that the data might contains less outliers and thus justifies normality assumption.

Box plots
Box plots are another kind of graphical representation where box is made with the median value of data set. The middle line of the box represents the median of data and upper or lower value of this box plot indicates outliers. For example, in Figure 3 below, box plot contains no value at upper or lower level which indicates absence of outliers. However, in Figure 4, the box plot’s upper value is 2 (at highest percentile), while the lower value is 21 (at lowest percentile) which indicates their presence.


Other methods to detect outliers
Extreme value analysis: This is the most basic form of detecting outliers. The analysis is based on simple assumption that any value, too large or too small is outliers. Z-test or T-test are useful in performing this analysis. For instance, any Z-score obtained for a distribution comprising value greater than 3 or less than -3 is considered to be an outlier.
Proximity based detection: Proximity based methods deal with the distance formula to identify outliers. These models too perform the same function, i.e. detecting them as those points which are far away from other observations in the dataset. Techniques like cluster analysis, density based analysis and nearest neighbor are main approaches to detect them.
Probabilistic and statistical models: This model assumes specific distribution for data (like, normal, binomial or Bernoulli). Then the expectation maximization method helps identify the parameters of model. The last step is to detect the probability of membership of each data point to calculated distribution. Finally, the points with lowest membership are diagnosed as outliers.
Application of outlier diagnostics
Outlier diagnostic is applied in all those cases where inferential analysis is performed, such as correlation, regression, forecasting and predictive modeling. Therefore it is useful in any statistical analysis where distribution of data is important.
Software that support outlier diagnostic applications are R, SAS, MATLAB, STATA and SPSS.
Discuss