Principal component analysis (PCA) of environmental sustainability indicators
This study aims to understand the environmental sustainability performance of the Indian automobile sector. It analyzes the various environmental indicators used by companies to report their sustainability efforts. using Principal Component Analysis (PCA), a statistical technique, to reduce the number of environmental indicators to the most relevant ones.
These indicators are the most important in defining the environmental sustainability performance of Indian automobile companies. They cover crucial aspects like energy consumption, water usage, and waste management. By focusing on these high-impact metrics, companies can significantly improve their environmental footprint.
The main objective is to identify the key environmental indicators that contribute the most to the overall environmental sustainability of automobile companies in India. The study hypothesizes that a few critical indicators can effectively capture the environmental sustainability performance, rather than using a large number of indicators.
Environmental degradation due to the automobile sector
The automotive industry is one of the biggest contributors to carbon emissions. According to Mataciunas (2023), the automotive manufacturing industry accounts for 10% of global industrial emissions, with a significant portion of it emerging in the production stage, while the end-of-life cycle recycling stage accounts for 5%. The manufacture of a single petrol or diesel car emits 5.6 tonnes of CO2 on average. Automakers need to incorporate strict measures to curb these emissions.
Environmental sustainability initiatives include strategies such as energy-efficient production facilities, the use of sustainable materials, sustainable supply chain strategies, recycling mechanisms, and transparent sustainability reporting. The impact of these measures are disclosed and published in the organization’s sustainability reports. However, there are many indicators of environmental sustainability which aid them in monitoring environmental health, policy and decision making, and making progress towards their goals. The figure below shows the commonly used environmental sustainability indicators in the automobile sector.

As can be seen in the figure above and the table below, the following are some of the most widely used indicators of environmental sustainability in businesses:
| Type of indicator | Indicator name |
|---|---|
| Energy and water management | Renewable energy used |
| Non-renewable energy used | |
| Total energy used | |
| Total fuel consumed | |
| Energy efficiency | |
| Water consumed | |
| Water recycled/ reused | |
| Water intensity | |
| Water waste | |
| Waste management | Solid waste produced |
| Hazardous waste produced | |
| Non-hazardous waste produced | |
| Recycled/ reused waste | |
| Disposed waste | |
| Pollution control | GHG (Scope 1, Scope 2, Scope 3) emissions |
| Air pollution (NOx, Sox,PM) | |
| Carbon footprint | |
| Toxic releases in air and water | |
| Noise pollution | |
| Light pollution | |
| Land use | |
| Deforestation | |
| Environmental compliance | Environmental law violations |
| Environmental management systems | |
| Environmental reporting | |
| Environmental risk assessment | |
| Environmental education & training | |
| Innovation & Sustainability practices | R&D investment |
| Environmental expenditure | |
| Green packaging & design | |
| Product recyclability | |
| Reused/ recycled packaging | |
| Materials used | |
| Renewable materials | |
| Non renewable materials | |
| Lifecycle assessment | |
| Supplier assessment | |
| Environmental accidents | |
| Biodiversity |
Importance of dimensionality reduction for environmental sustainability indicators
While these indicators provide a comprehensive framework for sustainability reporting, it is unclear whether they are all equally effective in measuring their respective dimensions of sustainability. Some indicators may contribute significantly to defining environmental or social sustainability, while others might add little value or introduce redundancy. For instance, Lisowski et al., (2020) initially identified 247 indicators of environmental sustainability in the automobile sector, of which only 31 were found to be relevant. Similarly, Li et al., (2012) found that out of 32 sustainability indicators, only 13 were found to be relevant after empirical examination of sustainability reports of electronics companies.
Not only does dimensionality reduction offer a comprehensive examination of companies’ sustainability performance but it also identifies areas of improvement. Dimensionality reduction is important because there is a “practical difficulty in working with a large number of metrics, and the goal is to reduce it to a more manageable set of core indicators addressing many different areas” (Munier, 2011). Moreover, sustainability is a complex phenomenon, and to capture its complexity, composite indices must be created by integrating multiple indicators (Gan et al., 2017). Nathan and Reddy, (2011) propose the following criteria, which must be met by a dimensionality reduction technique for sustainability indicators:
- The number of indicators must be neither too large nor too small, but an exact representation of the given situation.
- The chosen indicators must be relevant to the objective, simple to understand, analytically sound, and ensure policy responsiveness.
Thus, Principal Component Analysis (PCA) was used to reduce the number of environmental sustainability indicators to 3 or 4 which accurately represent the companies’ environmental sustainability performance, a more manageable number.
Each ‘principal component’ derived by the Principal Component Analysis (PCA) captures a significant portion of the total variance in the original data. PCA helps uncover hidden patterns and relationships among environmental variables. It highlights the most influential factors driving environmental changes.
A PC might represent a combination of variables related to pollution levels, climate change, or land degradation. By reducing the number of variables, PCA can simplify complex statistical models, such as regression or classification models, leading to more accurate and interpretable models.
Therefore, this article aims to identify which of the many environmental sustainability indicators are relevant to the Indian automobile industry. The purpose is to help the automobile sector improve its environmental sustainability practices by focusing specifically on the relevant indicators. This will help them not only achieve their sustainability goals more simply and efficiently but also improve the environmental performance of the country to a large extent.
Data Collection
The dataset utilized in this study contains comprehensive information on the social sustainability indicators reported by automotive companies. Seventeen automobile companies listed in the Bombay Stock Exchange (BSE) and National Stock Exchange (NSE) in the year 2024 were included in our dataset Although we aimed to consider all the listed automobile companies, some such as Sundaram Fasteners and Cummins India did not provide any information about their sustainability practices and outcomes in their annual reports. Therefore, the final dataset consisted of 17 companies:
- Ashok Leyland
- Apollo Tyres
- Bajaj Auto
- Balakrishna Industries
- Bosch
- Eicher Motors
- Escorts Kubota
- Hero Motors
- Mahindra & Mahindra
- Maruti Suzuki
- Motherson Samvardhana
- MRF Tyres
- SML Isuzu
- Tata Motors
- Tube Investments
- TVS Motors
- Force Motors
In the previous milestone, we identified over 35 environmental indicators which are relevant to the automobile and automotive sector; however, a careful examination of the above companies’ BSBR (business responsibility and sustainability report) and annual reports for the year 2024 showed that many indicators were not reported. For instance, none of the companies reported their R&D investments in sustainable technology development, land use, deforestation measures, and lifecycle assessment methods. A few other indicators were commonly used in Indian automobile companies. We, therefore, selected only those environmental sustainability indicators which were available in the BSBR and annual reports of most companies in our dataset.
However, since the original purpose of this study is to assess not only environmental sustainability performance but also social sustainability, the original dataset of this study consisted of social sustainability indicators too. Therefore, one of the preliminary steps in the data analysis process is to classify and eliminate the social sustainability indicators from the dataset. This will enable us to perform the Principal Component Analysis (PCA) test on the environmental sustainability indicators only.
Step 1: Loading the data into a new Google Colab Notebook
The dataset for this study was presented in the form of a Microsoft Excel file consisting of 17 environmental sustainability indicators and 8 social sustainability indicators, and the names of the 17 automobile companies. The first step in conducting a PCA test using Google Colab is to import the dataset.
Step 2: Pre-processing the data by changing the data type
Before proceeding with Principal Component Analysis (PCA) analysis, we want to ensure that all the data is numerical. This is because sometimes data can be identified as text data by a statistical application. In that case it is not possible to run a test like PCA because it relies on mathematical operations such as calculating variances, covariances, and eigenvectors. These operations require numeric inputs only.
Therefore, the second step in the PCA analysis process is to identify the data types of all columns in the dataset and assign appropriate data types.
The Scope 3 variable was of object type, so it was changed to float64 (numeric).
Step 3. Splitting the data into ‘Social’ and ‘Environmental’ DataFrames
After formatting the dataset, the next step was to eliminate the unnecessary columns from the dataset.
social_columns = ['Hired', 'Gender Diversity', 'LTIFR', 'Retention rate','Board diversity', 'Total trained employees/ workers','Independent Directors in Board', 'Total wages (in million)']

environmental_columns = ['Scope 1', 'Scope 2', 'Scope 3','Energy Consumed (GJ)', '% share of renewable electricity','Total Fuel Consumption (GJ)','Total Electricity Consumed (GJ)','Total Renewable Electricity (GJ)','CO2 sequestered through afforestation','through renewable energy','through eneregy saving projects','trees planted','Total water consumed (KL)','Water recycled','Waste Generated','Waste Disposed','Waste Recycled/Reused']

social_df = df[social_columns]

environmental_df = df[environmental_columns]

environmental_df_changed = environmental_df.dropna()

environmental_df = environmental_df.drop(['CO2 sequestered through afforestation','through renewable energy','through eneregy saving projects','trees planted', 'Water recycled'], axis=1)

environmental_df_final = environmental_df.dropna()
Following this, the social sustainability indicators were successfully separated.
Step 4: Removing missing values from the new dataframe
PCA requires that missing values be handled, as it cannot be performed on datasets with NaN values. It reduces the efficiency of the data. Therefore, it is essential to remove the rows with missing values from the new dataframe. This was done in two stages:
- First, the indicators having majorly missing values were identified manually in the Excel sheet. These were: ‘CO2 sequestered through afforestation’, ‘through renewable energy’, ‘through energy saving projects’, ‘trees planted’, and ‘Water recycled’.
- Next, I eliminated the rows with missing values from the remaining indicators.
environmental_df_final = environmental_df.dropna()With the completion of the preprocessing of the dataset, the next step was to begin the PCA analysis. it is a multi-stage process involving dataset normalisation, component selection, model fitting, determining explained variance, and finally, generating the scree plot and factor loadings.
Normalising the dataset for Principal Component Analysis (PCA) modelling
Principal Component Analysis (PCA) is a method used to simplify complex data while retaining important information. However, when dealing with different units of measurement, such as kiloliters of water, metric tons of GHG emissions, and Gigajoules of energy consumed, it is important to ‘normalise’ the dataset first.
If one feature ranges from 1 to 10 and another from 1 to 1,000,000, the second feature will dominate the PCA results simply because of its larger numbers. Thus, all measurements should be scaled with the same ratio for a comparable value.
Normalisation ensures that each feature contributes equally to the analysis. It helps Principal Component Analysis (PCA) to focus on the patterns in the data instead of being thrown off by the scales of the different features. In the case of this study, normalisation will allow for the comparison of indicators or their inclusion in an aggregate sustainability score.
scaler = MinMaxScaler()

environmental_df_final_scaled = scaler.fit_transform(environmental_df_final)

environmental_df_final_scaled = pd.DataFrame(environmental_df_final_scaled, columns=environmental_df_final.columns)
Principal Component Analysis (PCA) component selection
Now that the data is normalized, we can apply PCA to reduce the dimensionality and capture the variance. For this, it is essential to specify the number of components we want the dataset to be split into. The decision on the number of components rests on different criteria, such as domain knowledge or calculating the explained variance to determine it. For this study, I chose “1 principal component” representing the environmental dimension. Therefore, the number of principal components specified was 1.
pca = PCA(n_components=1)

pca.fit(environmental_df_final_scaled)

environmental_pca = pca.transform(environmental_df_final_scaled)

environmental_pca_df = pd.DataFrame(environmental_pca, columns=['Environmental Sustainability'])

print("PCA Result:")
print(environmental_pca_df)
PCA Result:
Environmental Sustainability
0 -0.321894
1 0.425495
2 -0.281159
3 -0.843456
4 -0.349436
5 1.468365
6 0.323005
7 0.348844
8 -0.769762
Principal Component Analysis (PCA) model fitting
Once the number of dimensions has been reduced from multiple indicators to 1 principal component, the next step is to perform PCA model fitting. This is enabled by generating the ‘shape’ of PCA results, which shows the (number of rows, number of columns).
print(environmental_pca.shape)(9,1)
With this specification, the PCA model is fitted on normalized data, and the results are derived. The PCA applied data frame shows that now the dimension of the data frame has reduced from 9 observations and 12 columns to 9 observations and 1 dimension i.e. environmental sustainability.
Generating the Principal Component Analysis (PCA) explained variance
The next step is to assess the explained variance of the PCA analysis results. The PCA explained variance ratio shows how much of the dataset’s information (variance) each principal component captures. It helps decide how many components to keep so that the important patterns can be retained while reducing complexity.
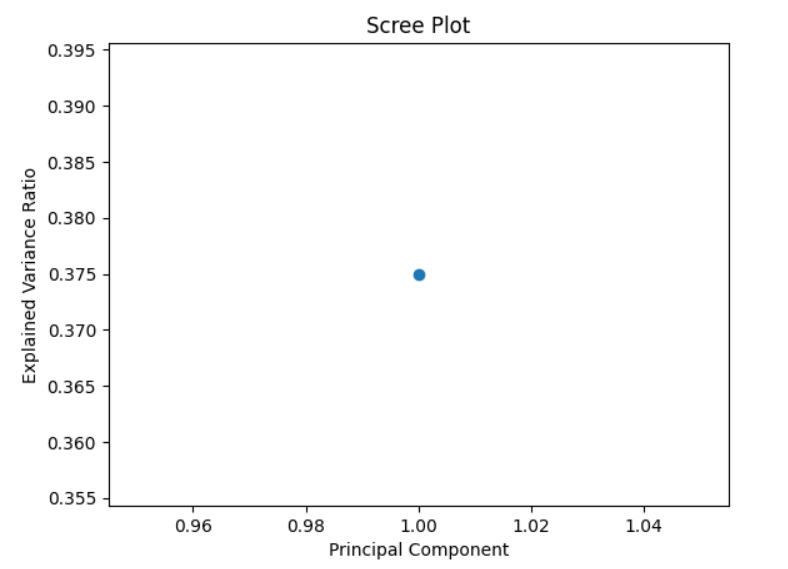
print(pca.explained_variance_ratio_)[0.37495768]
The explained variance ratio of the first principal component (PC1) is 37.49%. This means that the 1 component developed for representing the environmental sustainability explained a substantial portion (37.49%) of the total variance in indicators. By focusing on one component, we capture the most significant trends without adding complexity.
Generating the Scree plot and assessing the factor loadings
The next step in Principal Component Analysis (PCA) analysis is to generate the scree plot which shows the explained variance for each component. For this, the following prompt was entered, and the consequent code was autogenerated. Since the analysis has only one principal component, this scree plot shows only 1 component with the specified explained variance, i.e. 37.49%.
To assess the factor loadings of each indicator to the single principal component, i.e., revealing the contribution of each indicator to the environmental sustainability component. This will help us determine the relevant ones.
loadings = pd.DataFrame(pca.components_,columns=environmental_df_final_scaled.columns)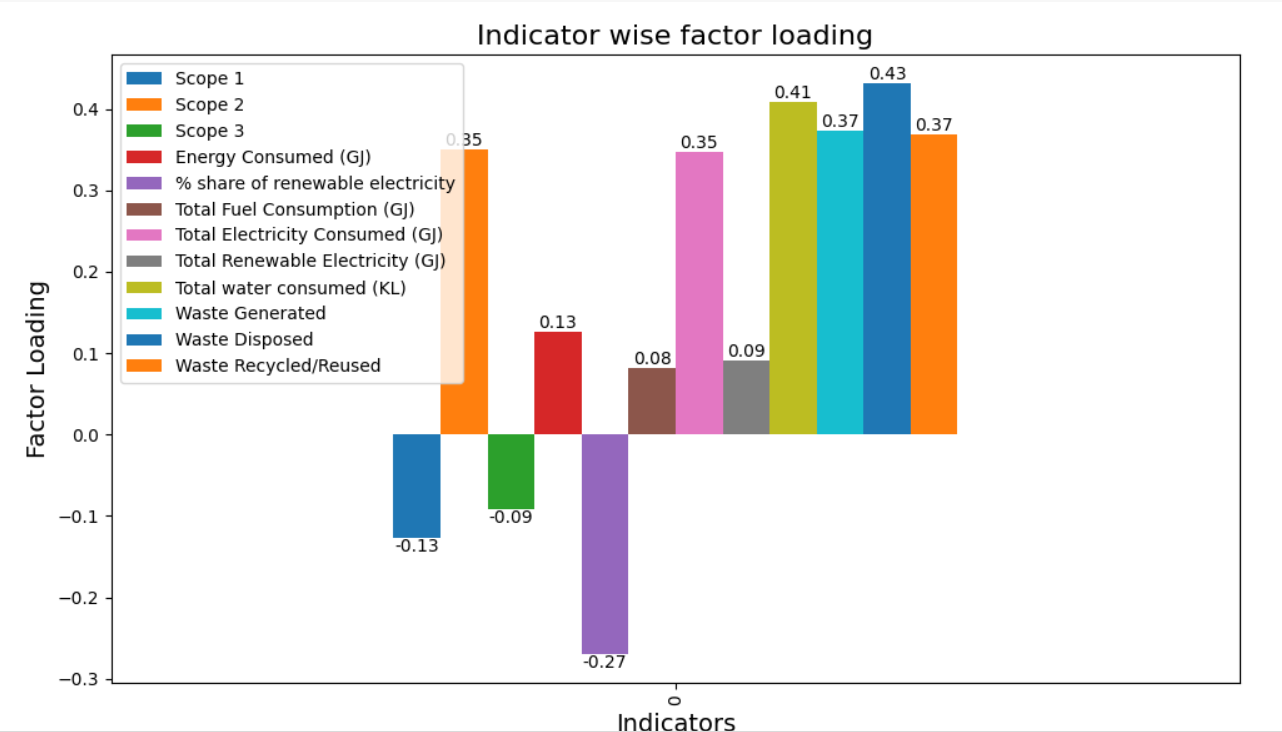
The above figure shows that:
- Total water consumed has a high factor loading of 0.41, indicating a strong contribution to the principal component. This suggests that total water consumed is a key determinant of environmental sustainability in the dataset.
- Waste disposed of has the highest factor loading, i.e. 0.43, meaning it has the strongest influence on the principal component. This implies that environmental sustainability, as measured by waste disposed of, is critical in defining environmental sustainability.
- Waste generated and waste recycled has a moderate loading of 0.37, showing a noticeable but less significant contribution to the principal component. It plays a role in environmental sustainability but is not as impactful as waste disposal or total water consumed.
- Total electricity consumed also has a moderate contribution of 0.35, slightly lower than the waste generated and waste recycled. This indicates that total electricity consumed impacts environmental sustainability but is secondary to water consumed and waste disposed.
- Total Fuel Consumption has the lowest factor loading, i.e. 0.08, suggesting a minimal contribution to the principal component. While Total Fuel Consumption is relevant, it is not as impactful in defining environmental sustainability in this dataset.
Based on the trend in factor loading, I have selected approximately 0.3 as the criterion for identifying the most relevant indicators for measuring the environmental sustainability indicator.
final_indicators = loadings.columns[abs(loadings.iloc[0]) >= 0.3].tolist()
print("Final Indicators with approximate factor loading value 0.3 or more:")
print(final_indicators)
Final Indicators with approximate factor loading value 0.3 or more:
['Scope 2', 'Total Electricity Consumed (GJ)', 'Total water consumed (KL)', 'Waste Generated', 'Waste Disposed', 'Waste Recycled/Reused']
The indicators with the most substantial loadings, contributing significantly to the environmental sustainability score, are Scope 2 emissions, Total Electricity Consumed, Total Water Consumed, Waste Generated, Waste Disposed, and Waste Recycled/ Reused. These factors are crucial for achieving high environmental sustainability performance.
Focusing on key areas to reduce environmental impact
Sustainability has become a fundamental parameter for evaluating organizational practices, especially within industries like automotive, where environmental and social factors are gaining increased attention. The automotive industry is responsible for 10% of all carbon emissions in the world (McKnight and Farhni, 2024), and this statistic is set to worsen with 80 million new vehicles being produced every year. Several policymakers and environmental activists acknowledge the intensity of this threat. Researchers have proposed frameworks to constantly monitor companies’ sustainability performance so that corrective measures can be implemented.
The World Economic Forum’s RAVC (Resilient and Sustainability Automotive Value Chain) initiative maps existing targets, regulations, tools and collaborative initiatives across the SDGs for a comprehensive overview of the sector’s sustainability landscape. It offers a way for companies to prioritise key areas of the supply chain critical for resilience and sustainability.
Similarly, (Jasiński, Meredith and Kirwan, 2016) proposed the ‘automotive sustainability assessment framework’ which segregates the life cycle stages of the automotive sector, identifies the midpoints and the endpoints based on the type of sustainability impact: environmental, resource, social, and economic. The universal purpose of these frameworks is to help the automobile sector reduce its environmental and social impact by focusing on key areas of control.
The study proposed that the statistical test of Principal Component Analysis (PCA) can be used as an effective tool to reduce the complexity of sustainability related data of companies. The sustainability performance reported in their sustainability reports and annual reports contains information on a wide range of indicators related to environmental, social, and organisational sustainability. Since over 200 such indicators can be reported in a single report, it becomes challenging for companies to identify key areas which have the biggest impact.
Emissions can be much worse than water consumption at a company.
Reducing the number of indicators can save time and resources needed to make their sustainability actions efficient. The results from the inspection of seventeen major automobile companies in India for the 2024 reports showed that the main indicators that they must focus on are:
- Scope 2 emissions
- Total Electricity Consumed
- Total Water Consumed
- Waste Generated
- Waste Disposed
- Waste Recycled/ Reused
This means that simply focusing on the above indicators instead of all environmental sustainability indicators can create a huge impact on the environment.
Scope 2 emissions
Scope 2 emissions are indirect emissions from electricity, heat or steam that companies purchase and use. Although not directly in control of the emissions, by using the energy, they are indirectly responsible for the release of CO2. The figure below shows the contributors of scope 1, 2 and 3 emissions in the automobile sector.
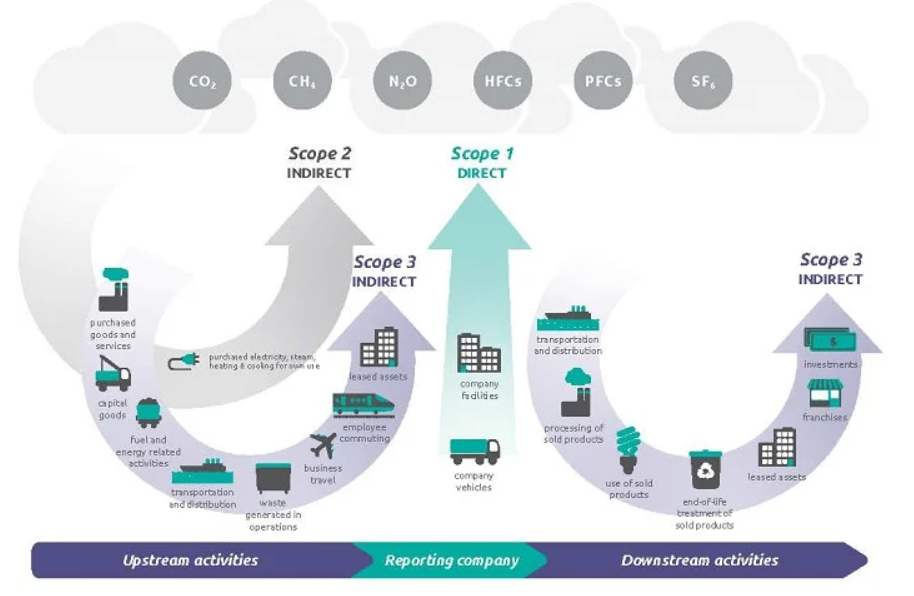
Studies have shown that scope 2 emissions contribute to less than 5% of GHG emissions, and Scope 3 is the biggest contributor (Park et al., 2024). However, it is difficult to estimate the amount of emissions caused by Scope 3 activities accurately because they depend on activities beyond the primary company’s control, like what suppliers produce and how customers use their products (Climate Impact Partners, 2024). Moreover, (Vieira, Longo and Mura, 2024) identified other critical limitations of Scope 3 emissions as a reliable indicator: mapping the complexity of a company’s value chain due to the presence of many independent businesses, and its reliance on estimates from secondary data of its suppliers rather than accurate primary data sourced directly from them. This makes scope 3 emissions a less reliable indicator of the environmental emissions of automobile companies. Scope 2 emissions, on the other hand, can be explained as relevant because of companies’ increasing demand for electricity as they produce more vehicles every year.
Total electricity consumed
Consistent with scope 2 emissions, ‘total electricity consumed’ also emerged as a key indicator of environmental sustainability in automobile companies. Total electricity consumed refers to the number of units of electricity demanded and availed by a company during a particular year. (Shakti Foundation, 2013) offers the following equation to calculate the total energy consumed by an automobile manufacturing facility:

Much research has been done in the past to identify electricity consumption as an important indicator of environmental sustainability in the automobile sector (Chou et al., 2015; Romero et al., 2024). Factors like vehicle design and technology, operational usage, and transportation policies and planning play a huge role in the electricity consumed. Due to the rise in several number of vehicles produced, the overall electricity demand is rising. Moreover, although electric vehicles produce 17-30% less carbon emissions than fossil fuel vehicles when in operation, they emit 25% more CO2 in the manufacturing process due to the production of their batteries, further straining the electricity demanded (Linder et al., 2023). Therefore, our findings can be substantiated by past studies as evidence.
Total water consumed
Just like electricity, the automobile sector is one of the major consumers of water too (Dupont Water Solutions, 2024; Semmens, Bras and Guldberg, 2024). According to (Babel et al., 2020), on average, 4.94 m3 of water is used directly to produce a car. The authors compared the performance of five global automobile companies: BMW, Daimler, FCA, Nissan, and Volkswagen, and found that despite being the most energy-efficient company, BMW needs to reduce its water consumption by 38% if it wants to achieve its sustainability targets. Another critical study on European carmakers was conducted by (Berger et al., 2024) who found the average water consumption to be much higher in 2024 at 52 to 83 m(3)/car, of which more than 95% is consumed in the production phase, mainly resulting from producing iron, steel, precious metals, and polymers. They analysed the water consumption patterns along different phases of the automobile life cycle, as shown in the figure below.

By contrast, Indian carmakers use an average of 12 to 20 m3 of water per car. This figure, although better than the European counterparts, is still higher than the 2.25 m3 per vehicle used by BMW (BMW Group, 2024). Conscious and consistent efforts must be taken by India’s automakers to improve their water consumption performance to achieve their sustainability targets. Therefore, total water consumed is a potential key catalyst in automakers’ transition to a highly sustainable sector.
Waste generated, disposed of, and recycled
The last three indicators of environmental sustainability, which emerged as highly relevant to the principal component, were related to waste management: waste generated, waste disposed of, and waste recycled. The automobile sector is also a major material consumer. Automotive waste is called ‘end of life vehicle (ELV) waste’ and constitutes materials like ferrous and nonferrous metals, plastic, tires and rubber, glass, fluids, battery, electricals, and process polymers (Tshifularo and Patnaik, 2024). End-of-life vehicles aim to improve recycling by requiring 85% recyclability and 95% recoverability. However, 25% of the waste, called Auto Shredder Residue (ASR), still ends up in landfills. ASR mainly consists of foams and fluff (40-52%), plastics (20-27%), rubbers (18-22%), and metals (4-15%), with no affordable recycling solution currently available for plastics and foam (Sharma et al., 2016). This makes waste management, especially in ELVs, a critical issue for recycling experts in the automotive sector as well as policymakers. For instance, according to European ELV Directive 2000/53/EC, which sets minimum recycling and recovery targets for vehicles to promote environmental sustainability, at least 85% by weight of the vehicle must be recyclable or reusable, and at least 95% by weight of the vehicle must be recoverable. Currently, these targets are being missed by automakers (Blenkinsop, 2024). This makes waste management another critical issue for the automobile sector’s sustainability target, substantiating our empirical findings from the Principal Component Analysis (PCA).
Our findings thus emphasise the importance of aligning automakers’ operational strategies with these critical indicators to improve environmental sustainability performance. By focusing on these high-impact metrics, automotive companies can enhance their contribution to the UN Sustainable Development Goals while simultaneously strengthening their brand value. The application of Principal Component Analysis (PCA) not only simplifies the analysis of complex sustainability datasets but also ensures precision in identifying impactful variables. As the automotive sector continues to adopt sustainable practices, incorporating the identified indicators into strategy and reporting frameworks will be pivotal for fostering long-term social and environmental well-being.
References
- Helman, J., Rosienkiewicz, M., Cholewa, M., Molasy, M., & Oleszek, S. (2023). Towards GreenPLM—Key Sustainable Indicators Selection and Assessment Method Development. Energies, 16(3), 1137. https://doi.org/10.3390/en16031137
- Husgafvel, R. (2021). Exploring Social Sustainability Handprint—Part 2: Sustainable Development and Sustainability. Sustainability, 13(19), 11051. https://doi.org/10.3390/su131911051
- Jolliffe, I. T., & Cadima, J. (2016). Principal component analysis: a review and recent developments. Philosophical Transactions of the Royal Society a Mathematical Physical and Engineering Sciences, 374(2065), 20150202. https://doi.org/10.1098/rsta.2015.0202
- Lukin, E., Krajnović, A., & Bosna, J. (2022). Sustainability Strategies and Achieving SDGs: A comparative analysis of leading companies in the automotive industry. Sustainability, 14(7), 4000. https://doi.org/10.3390/su14074000
- Ly, A. M., & Cope, M. R. (2023). New Conceptual Model of Social Sustainability: Review from Past Concepts and Ideas. International Journal of Environmental Research and Public Health, 20(7), 5350. https://doi.org/10.3390/ijerph20075350
- Rajesh, R. (2020). Exploring the sustainability performances of firms using environmental, social, and governance scores. Journal of Cleaner Production, 247. https://doi.org/10.1016/j.jclepro.2019.119600
- Vijayakumar, A., Mahmood, M. N., Gurmu, A., Kamardeen, I., & Alam, S. (2022). Social sustainability indicators for road infrastructure projects: A systematic literature review. IOP Conference Series Earth and Environmental Science, 1101(2), 022039. https://doi.org/10.1088/1755-1315/1101/2/022039
- Pfister, S., Koehler, A., & Hellweg, S. (2009). Assessing the environmental impacts of freshwater consumption in LCA. Environmental science & technology, 43(11), 4098-4104.
- Moldan, B., Janoušková, S., & Hák, T. (2012). How to understand and measure environmental sustainability: Indicators and targets. Ecological indicators, 17, 4-13.
- Wilson, D. C., Rodic, L., Cowing, M. J., Velis, C. A., Whiteman, A. D., Scheinberg, A., … & Oelz, B. (2015). ‘Wasteaware’benchmark indicators for integrated sustainable waste management in cities. Waste management, 35, 329-342.
- Howell, B. (2024). The Importance of Environmental Sustainability. Retrieved from https://blog.cleanhub.com/importance-issues-and-benefits-of-environmental-sustainability
- Martins, F., Felgueiras, C., Smitkova, M., & Caetano, N. (2019). Analysis of fossil fuel energy consumption and environmental impacts in European countries. Energies, 12(6), 964.
- Babel, M.S. et al. (2020) ‘Comparative study of water and energy use in selected automobile manufacturing industries’, Journal of Cleaner Production, 246, p. 118970. Available at: https://doi.org/10.1016/j.jclepro.2019.118970.
- Berger, M. et al. (2024) ‘Water Footprint of European Cars: Potential Impacts of Water Consumption along Automobile Life Cycles | Request PDF’, ResearchGate, 46(7), pp. 4091–9. Available at: https://doi.org/10.1021/es2040043.
- Blenkinsop, P. (2024) ‘Europe set to miss potential for battery material recycling’, Reuters, 11 December. Available at: https://www.reuters.com/world/europe/europe-set-miss-potential-battery-material-recycling-2024-12-11/ (Accessed: 28 December 2024).
- BMW Group (2024) Every gramm, every watt, every liter counts. Available at: https://www.bmwgroup.com/en/news/general/2021/sustainable-production.html (Accessed: 28 December 2024).
- Chou, C.-W. et al. (2015) ‘The Role of Technical Innovation and Sustainability on Energy Consumption: A Case Study on the Taiwanese Automobile Industry’, Energies, 8(7), pp. 6627–6640. Available at: https://doi.org/10.3390/en8076627.
- Climate Impact Partners (2024) Scope 1, 2, and 3 Emissions. Available at: https://www.climateimpact.com/news-insights/insights/scope-1-2-3-emissions/ (Accessed: 27 December 2024).
- Dupont Water Solutions (2024) Water Sustainability For The Automotive Industry | Water Solutions. Available at: https://www.dupont.com/knowledge/water-efficiency-in-the-automotive-industry.html (Accessed: 28 December 2024).
- Gan, X. et al. (2017) ‘When to use what: Methods for weighting and aggregating sustainability indicators’, Ecological Indicators, 81, pp. 491–502. Available at: https://doi.org/10.1016/j.ecolind.2017.05.068.
- Jasiński, D., Meredith, J. and Kirwan, K. (2016) ‘A comprehensive framework for automotive sustainability assessment’, Journal of Cleaner Production, 135, pp. 1034–1044. Available at: https://doi.org/10.1016/j.jclepro.2016.07.027.
- Li, T. et al. (2012) ‘A PCA-based method for construction of composite sustainability indicators’, Int J Life Cycle Assess, 17.
- Linder, M. et al. (2023) The race to decarbonize electric-vehicle batteries | McKinsey, McKinsey. Available at: https://www.mckinsey.com/industries/automotive-and-assembly/our-insights/the-race-to-decarbonize-electric-vehicle-batteries (Accessed: 27 December 2024).
- Lisowski, S. et al. (2020) ‘Criteria-Based Approach to Select Relevant Environmental SDG Indicators for the Automobile Industry’, Sustainability, 12(21), p. 8811. Available at: https://doi.org/10.3390/su12218811.
- Mataciunas, M. (2023) Automotive manufacturing and net zero, ICM Summit. Available at: https://icm-summit.com/automatization-robotization/automotive-manufacturing-and-net-zero/ (Accessed: 11 March 2025).
- McKnight, L. and Farhni, S. (2024) How to navigate sustainability in the automotive industry, World Economic Forum. Available at: https://www.weforum.org/stories/2024/05/how-to-navigate-sustainability-in-the-automotive-industry/ (Accessed: 27 December 2024).
- Munier, N. (2011) ‘Methodology to select a set of urban sustainability indicators to measure the state of the city, and performance assessment’, Ecological Indicators, 11(5), pp. 1020–1026. Available at: https://doi.org/10.1016/j.ecolind.2011.01.006.
- Nathan, H.S.K. and Reddy, B.S. (2011) ‘Criteria selection framework for sustainable development indicators’, International Journal of Multicriteria Decision Making, 1(3), p. 257. Available at: https://doi.org/10.1504/IJMCDM.2011.041189.
- Park, Y. et al. (2024) ‘Characterization of the life cycle carbon footprint of the automobile industry in the Republic of Korea by environmentally extended input-output model’, Environmental Engineering Research, 29(5). Available at: https://doi.org/10.4491/eer.2023.583.
- Romero, C.A. et al. (2024) ‘Strategies for Reducing Automobile Fuel Consumption’, Applied Sciences, 14(2), p. 910. Available at: https://doi.org/10.3390/app14020910.
- Semmens, J., Bras, B. and Guldberg, T. (2024) ‘Vehicle manufacturing water use and consumption: An analysis based on data in automotive manufacturers’ sustainability reports | Request PDF’, ResearchGate, 19(1). Available at: https://doi.org/10.1007/s11367-013-0612-2.
- Shakti Foundation (2013) Widening the coverage of PAT Scheme. Shakti Foundation. Available at: https://shaktifoundation.in/wp-content/uploads/2017/06/widening-of-pat-sectors-automobile.pdf.
- Sharma, P. et al. (2016) ‘Automobile Waste and Its Management’, RJCES, 4(2).
- Tshifularo, C. and Patnaik, A. (2024) ‘Automotive waste management technologies’, in Waste Management in the Fashion and Textile Industries. ELsevier. Available at: https://doi.org/10.1016/B978-0-12-818758-6.00010-7.
- Vieira, L.C., Longo, M. and Mura, M. (2024) ‘Impact pathways: the hidden challenges of Scope 3 emissions measurement and management’, International Journal of Operations & Production Management, 44(13), pp. 326–334. Available at: https://doi.org/10.1108/IJOPM-01-2024-0049.
I am an interdisciplinary educator, researcher, and technologist with over a decade of experience in applied coding, educational design, and research mentorship in fields spanning management, marketing, behavioral science, machine learning, and natural language processing. I specialize in simplifying complex topics such as sentiment analysis, adaptive assessments and data visualizatiion. My training approach emphasizes real-world application, clear interpretation of results and the integration of data mining, processing, and modeling techniques to drive informed strategies across academic and industry domains.
I am a management graduate with specialisation in Marketing and Finance. I have over 12 years' experience in research and analysis. This includes fundamental and applied research in the domains of management and social sciences. I am well versed with academic research principles. Over the years i have developed a mastery in different types of data analysis on different applications like SPSS, Amos, and NVIVO. My expertise lies in inferring the findings and creating actionable strategies based on them.
Over the past decade I have also built a profile as a researcher on Project Guru's Knowledge Tank division. I have penned over 200 articles that have earned me 400+ citations so far. My Google Scholar profile can be accessed here.
I now consult university faculty through Faculty Development Programs (FDPs) on the latest developments in the field of research. I also guide individual researchers on how they can commercialise their inventions or research findings. Other developments im actively involved in at Project Guru include strengthening the "Publish" division as a bridge between industry and academia by bringing together experienced research persons, learners, and practitioners to collaboratively work on a common goal.
Discuss