Challenges of using different bibliometrics and data analysis software
In the preceding article, the challenges presented with respect to selection of the field of study and collection of data in bibliometrics. However as mentioned, bibliometrics is the statistical analysis of bibliographic data from journals, books, documents, and other conference proceedings (Kurtz & Bollen, 2010). Furthermore, challenges of bibliometrics arise at every step of the study, selection of the specific software, and type of analyses done. Thus, this article presented both the challenges and the solutions occurring in data analysis of bibliometrics.
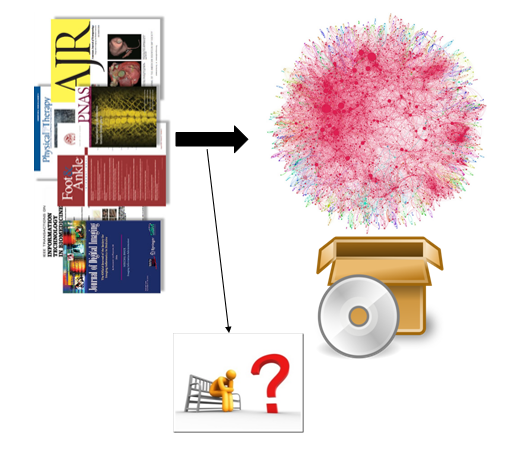
The basic flow or process of bibliometrics is:

Challenges of selection of software and data analysis is one of the major setbacks in a bibliometric study. However, there are softwares available with both free and limited access. Henceforth, the selection of software is completely on the basis of the data analyses chosen.
Types of software and analyses for bibliometrics
A simple frequency analysis could be done on MS Excel, BibExcel, R and SPSS, whereas network and mapping analyses uses Pajek, CiteSpace, VosView, MatLab and others and for citation analyses Publish or Perish, Clarivate Analytics, BibExcel and others (Chen, Lin, Huang, & Huang, 2010; Harzing, 2008; Salini, 2012; Singh & Komal, 2009; Van Eck, Waltman, Dekker, & Van Den Berg, 2010). However, the most commonly used software are BibExcel, SPSS, Pajek, Citespace, Publish or Perish and VosView.
Description of the software
Bibexcel is an indispensable tool for conversion and treatment of bibliographic data and moreover it is freely available (Arsenova, 2013). It also contains an abundance of routines for creating different types of bibliometric analyses. Again, Publish or perish on the other hand, based on data from Google Scholar creates bibliometric analyses of researchers including H index and other citation metrics (Harzing, 2008). On the other hand, Pajek is used for different kinds of network analyses and visualizations. Citespace helps to analyze, visualize and cluster (mainly) bibliographic data (Guler, Waaijer, & Palmblad, 2016). Lastly, Vosview, a software for mapping and network bibliometrics based on the availability of the desired file format (Van Eck et al., 2010).
Challenges associated with the softwares
The main challenge is that there are various software available but not a particular one that would help in any type of data analysis. Moreover, every software has its own format or file extension for analysis, when not available cannot perform bibliometrics. However, “.ris” is the most common form of file extension that can read by most of the software available (Guler et al., 2016; Salini, 2012). Furthermore, another issue is that the manuals available for software, not properly constructed. Henceforth a new researcher finds it very difficult to choose the appropriate software for data analysis. However, analyses showed that various software are either directly linked to Web of Science or Scopus. Hence, the researcher with no access to such web libraries have face limitations (Salini, 2012).
Overcoming the challenge
With respect to the data analysis and selection of the software, it is important that the type of analysis done by the software is well known. In addition, the importance of every software and how they operate is also important to acknowledge so that the selection of the suitable data is in congruent to the aim of the bibliometric study. However, the selection of software depends on whether it is required for descriptive analysis or citation analysis or bibliometric mapping or networking analysis. Another aspect to this is that in many cases the researcher combines one or more types of data analysis for more complicated analyses and in-depth studies.
However, the following table helps to identify which software used in which case. Furthermore, another acknowledgment in this respect is that certain statistics done manually whereby automated software not applicable or web based information from Clarivate analytics or Google Scholar used for descriptive or citation analyses. However, the researcher must also know how to integrate two or more software while conducting a bibliometric study.
List of table based on the usage of different softwares
| Data analyis | Type of software | File formats supported | Limited/open access | Recommendation level |
| Descriptive analyses | Bibexcel | .bibx, .txt, .csv | Open source | High |
| SPSS | .xls, .sav | Open source | Low | |
| MS Excel/Access | .xls, .accdb/.mdb | Open source | Moderate | |
| Publish or perish | .txt, .ris, .csv, .bibtex | Open source | High | |
| Citation analyses | Clarivate analytics | .ris, .bibtex | Limited | Low |
| SCOPUS | .ris, .csv, .txt | Limited | Low | |
| Publish or Perish | .txt, .ris, .csv, .bibtex | Open source | High | |
| Bibliometric mapping | Pajek | .net, .svg | Limited | Low |
| CiteSpace | .txt, .ris, .csv, .bibtex, .xls | Limited | Low | |
| VosView | .txt, .ris, .csv, .bibtex, .xls | Open source | High | |
| Matlab | .csv, .xls | Limited | Moderate | |
| File convertion software | Zotero | All formats | Open source | High |
| EndNote | .ris, .csv, .txt, .xls, .bibtex | Limited | High | |
| Mendeley | .ris, .csv, .txt | Open source | Moderate |
References
- Arsenova, I. (2013). New Application of Bibliometrics. Procedia – Social and Behavioral Sciences, 73, 678–682. https://doi.org/10.1016/j.sbspro.2013.02.105.
- Chen, D. Z., Lin, C. P., Huang, M. H., & Huang, C. Y. (2010). Constructing a new patent bibliometric performance measure by using modified citation rate analyses with dynamic backward citation windows. Scientometrics, 82(1), 149–163. https://doi.org/10.1007/s11192-009-0044-8.
- Guler, A. T., Waaijer, C. J. F., & Palmblad, M. (2016). Scientific workflows for bibliometrics. Scientometrics, 107(2), 385–398. https://doi.org/10.1007/s11192-016-1885-6.
- Harzing, A. (2008). Google Scholar-a new data source for citation analysis. University of Melbourne, 1–8. Retrieved from http://perso.telecom-paristech.fr/~maitre/LTCI/bibliometrie/harzing2.pdf%5Cnhttp://www.harzing.com/pop_gs.htm.
- Kurtz, M. J., & Bollen, J. (2010). Usage bibliometrics. Annual Review of Information Science and Technology, 44(1), 1–64. https://doi.org/10.1002/aris.2010.1440440108.
- Salini, S. (2012). An Introduction to Bibliometrics. In Research Methods for Postgraduates: Third Edition (pp. 130–143). https://doi.org/10.1002/9781118763025.ch14.
- Singh, V., & Komal. (2009). Prospects & Problems of Real Estate in India. International Research Journal of Finance & Economics, (24), 242–254.
- Van Eck, N. J., Waltman, L., Dekker, R., & Van Den Berg, J. (2010). A comparison of two techniques for bibliometric mapping: Multidimensional scaling and VOS. Journal of the American Society for Information Science and Technology, 61(12), 2405–2416. https://doi.org/10.1002/asi.21421.
I am a management graduate with specialisation in Marketing and Finance. I have over 12 years' experience in research and analysis. This includes fundamental and applied research in the domains of management and social sciences. I am well versed with academic research principles. Over the years i have developed a mastery in different types of data analysis on different applications like SPSS, Amos, and NVIVO. My expertise lies in inferring the findings and creating actionable strategies based on them.
Over the past decade I have also built a profile as a researcher on Project Guru's Knowledge Tank division. I have penned over 200 articles that have earned me 400+ citations so far. My Google Scholar profile can be accessed here.
I now consult university faculty through Faculty Development Programs (FDPs) on the latest developments in the field of research. I also guide individual researchers on how they can commercialise their inventions or research findings. Other developments im actively involved in at Project Guru include strengthening the "Publish" division as a bridge between industry and academia by bringing together experienced research persons, learners, and practitioners to collaboratively work on a common goal.
Discuss